A coincidence or a new reality?
Norway has its own very low spot price. West Denmark approaches the high spot price in Germany. The prices in Sweden and Finland fluctuate. What is going on? |

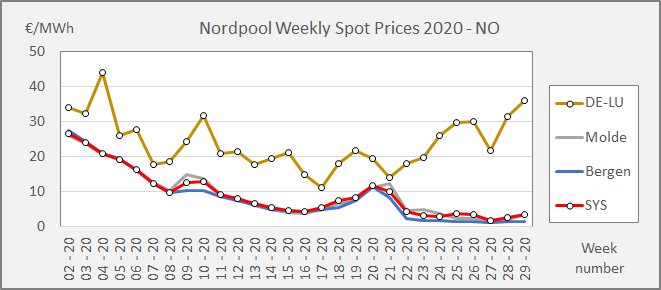
"SYS" is the Nordpool system price. The system price is supposed to be valid for all price zones in a grid without bottlenecks. However, the price differences from week 22 indicate limitations to the free flow. The grid is challenged by maintenance of Swedish nuclear units and broken HVDC cables between Norway and Denmark. Due to the reduced capacity between Norway and Denmark, the western Denmark (DK1) adopts the German price level (DE LU). The southern part of Sweden (SE3 and SE4) fluctuates in between. The Swedish concern about a possible shortage of power seems to have caused nervousness in the market with a rather high average price in week 26. |

This chart shows the four Swedish spot prices and the two "anchor prices", the Nordpool system price and the German spot price. SE1 and SE2 have the same price, until week 21 in most cases identical with the system price. The southernmost part of Sweden has the highest Swedish prices, while SE3 fluctuates between high and low prices depending on the location of the bottlenecks. |

This chart shows two Norwegian prices- Molde represents the northern part of Norway, while Bergen represents the souther part of Norway. The are different prices in the two parts og Norway, but the chart demonstrates that the differences are insignificant with the system price as the point of gravity. The conclusion is, that bottlenecks have isolated Norway with a surplus of electricity, while the much higher prices in Sweden and in the eastern part of Denmark (not shown in the chart) indicate a shortage. The question is if the situation this summer is a coincidence or a new reality. Weekly average prices in 2020 (Source: Nordpool). |
