The capacity of the Norwegian storages is 84.3 TWh or more than twice the Danish annual consumption of electricity. Due to an increasing consumption of electricity in Norway and a low inflow of water the content is very low.
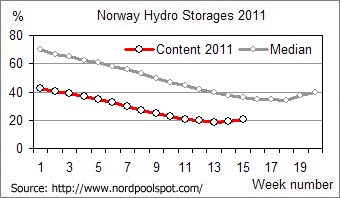
The median values have been calculated for the period 1990 to 2007. In order to save water Norway has a considerable import of electricity. The net import was 7.2 TWh in 2011 until 18th April.
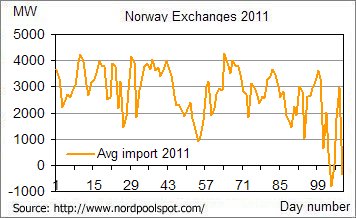
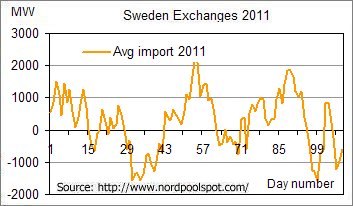
Hydro power covers nearly all electricity production in Norway. Hydro power plants are supplying only about half the Swedish electricity production. The capacity of the Swedish hydro storages is 33.8 TWh.

The median values have been calculated for the period 1950 to 2004. Due to the Swedish alternatives to hydro power the situation is not quite as bad as the chart might suggest. The net import was 650 GWh in 2011 until 18th April.
The NordPool spot prices reflect the market participants' opinion of the situation. A few area prices have been selected as examples together with the German EEX price.
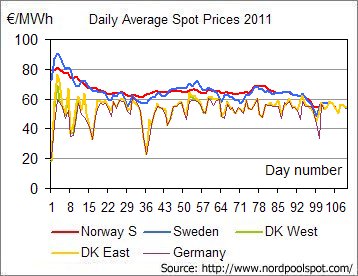
The most southerly part of Norway (N2) was selected. The chart shows that the Swedish and Norwegian spot prices are quite close. Differences reflect Swedish exchanges. The chart also confirms previous observations of a very close relationship between German and Danish prices.
The Danish net export was 3.0 TWh in 2011 until 18th April or about a third of Norway's and Sweden's net import during the same period.
The stable price level in Norway and Sweden seems to indicate that the market is confident that there will be no shortage of energy until the spring flood at the beginning of May.
I have previously demonstrated that wind power variations in Germany are nearly the same as in Denmark. The volatile spot prices could suggest a close relationship between wind power and spot prices.
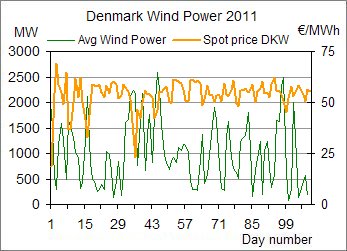
However, it is not that simple. The spot price can be more or less sensitive. During periods with very sensitive spot prices the wind power variations are clearly reflected. The deep spot price valleys on the charts clearly coincide with wind power peaks.
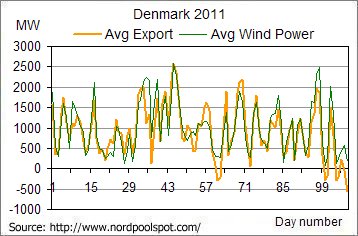
On the other hand there is an evident relationship between Danish wind power output and net export of electricity. The chart above seems to suggest that wind energy is being exported. However, this is not the way it should be considered. The hypothesis has been rejected by the Danish scientific elite within the energy area (se the debate on the CEPOS report 5th March 2010 and 30th March 2010).